Table of Contents
.avif)
At ASAPP we develop AI-driven platform features to improve agent efficiency. To be data-driven about feature development, we require a way to measure how well we’re performing. If we introduce something new (like a new feature), we want to know how that feature impacts agent efficiency so that we can learn from it to drive the next features. Because of the complex nature of confounding effects on both 1) the features we wish to analyze as well as 2) the response KPIs of interest, we require specialized techniques to disentangle these confounding effects to properly measure the impact of our features, which is described in this post.
We can think of agent efficiency as throughput of customer issues: the number of issues per agent per time. We can improve throughput both by decreasing agent handle time (AHT) for a single issue and by increasing concurrency (the number of issues an agents handles at the same time). This post specifically discusses how we measure AHT improvement gains enabled by agent augmentation and automation features in digital messaging application.

Calculating how much augmentation improves AHT
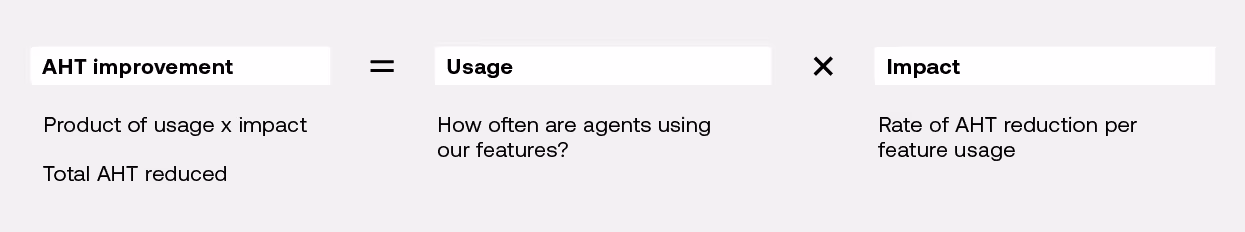
AHT improvement should not be measured by usage of a feature alone. Usage of a feature is a great signal about whether agents find our features useful to do their jobs (otherwise we would expect them not to use it). We can think of AHT improvement as the multiplication of both feature usage AND the feature’s impact on AHT when it is used.
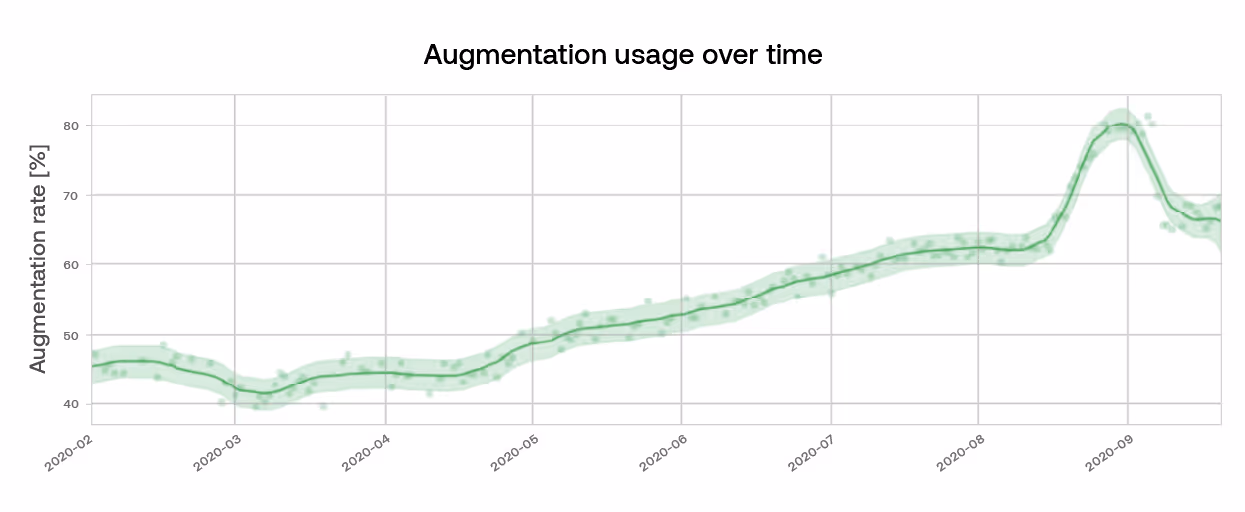
Usage is easy to measure: we have data events every time an agent clicks on a suggestion. Those events are aggregated nicely into tables that we can consume. And then we can plot the average daily augmentation rates over time, as in the graph below
But measuring impact is more difficult because there are other factors that contribute to AHT. For example, some types of customer issues naturally take longer to resolve than others (such as troubleshooting, where much of the handle time is waiting for devices to restart). If those types of issues happen to have a lower augmentation rate than other types of issues, it would be unfair to say that augmentation causes longer AHT, when it is moreso the content of the issue that contributes to longer AHT.

As use of agent augmentation features increase handle time decreases—and agents can manage concurrent conversations. This results in higher throughput.
Heather Reed, PhD
Measuring impact
While randomized experiments are the gold standard for measuring the causal effect of a treatment (e.g. a feature) on KPIs of interest (e.g. AHT), observational studies also enable measurement of feature impact without requiring experimentation. This becomes tricky because there are confounding factors that may impact both:
- Agents’ likelihood of using augmentation (e.g. some customer issues are more augmentable than others); and
- AHT (e.g. seasoned agents may be “naturally” faster at solving customer problems).
We can build a causal, statistical model to account for these confounding factors, constructed in such a way that we are able to isolate the impact of the variable that we are interested in (i.e. augmentation). We solve this problem by using random effects regression analysis.
In regression analysis, the goal is to fit regression parameters that describe the relationship between features and responses of interest. In random effects modeling, the regression parameters vary by group (e.g. by individual agent, types of issues, etc.), and the model accounts for both the average group effect (i.e. for all agents) as well as the offset between each agent’s effect and the group average. Random effects models are beneficial when the data exhibits a clustered structure and thus the data are not independent observations. The benefit of the random effects model is that in the absence of a lot of data for a value in the group (e.g. a new agent), the model shrinks the estimate for that agent toward the group average.
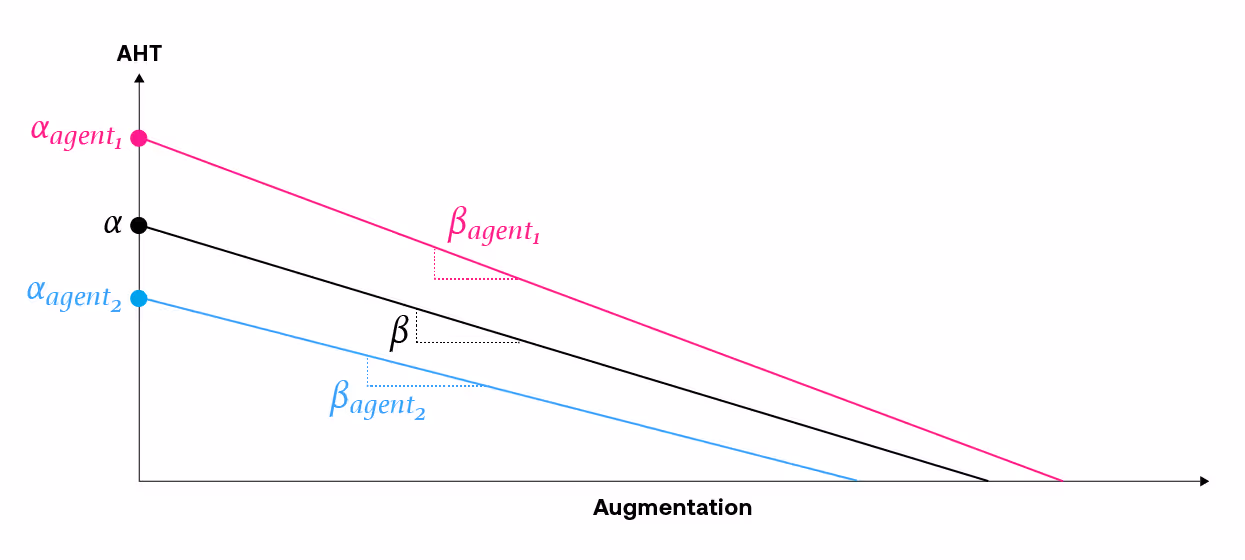
The schematic below demonstrates the concept of a random effects model where there is a group-varying intercept and slope. The black line represents the average effect for the group (i.e. all agents), and the pink and blue lines are the offsets from the group average that correspond to specific agents.
When constructing the statistical model, we consider the clustered and/or hierarchical nature of the data. Then, we fit this regression model with production data to learn what these model coefficients are (or more accurately, we learn the posterior distributions of these coefficients).
We then use this trained model to infer insights about augmentation. We do this by using the model to answer the counterfactual question, “What would the AHT have been, if there had been no agent augmentation?”. The difference between this potential AHT outcome and the real AHT provides an estimate of the AHT savings. We can take statistics across all issues (and subsets of issues) to learn insights or assess agent efficiency (proxied as AHT savings) over time, like the blue curve below.
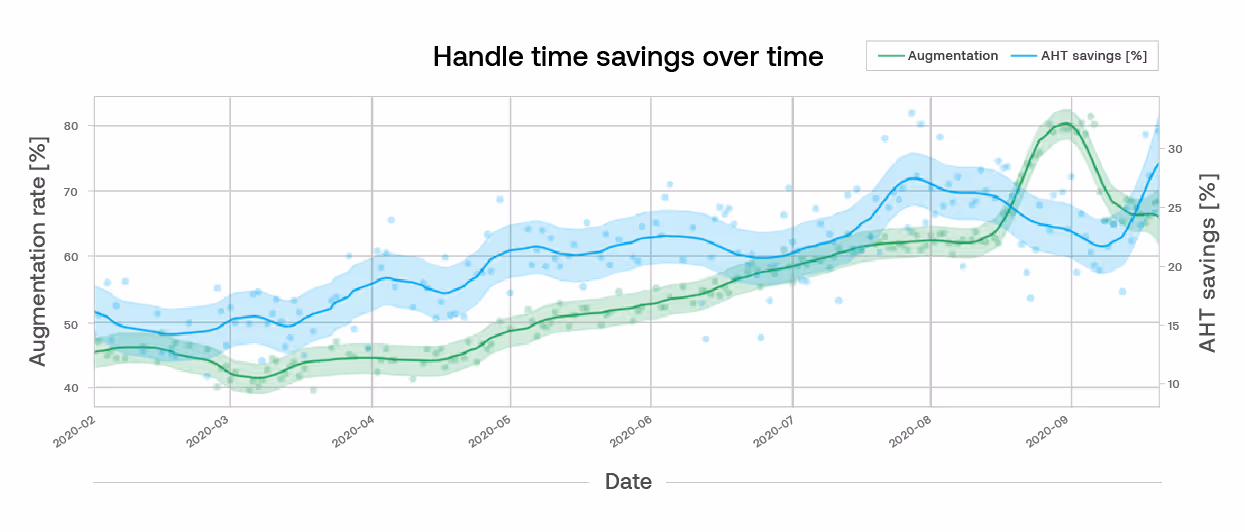
Using these approaches, we’re able to measure how much handle time our augmentation features save. The blue curve in the plot above shows a 100% increase in AHT savings (15% to 30%) over a period of 8 months. This is the result of both measuring the impact of new features as well as increasing usage of features that are driving increased impact (the green curve above). In this way we can quantify the value we deliver for our customers with current features and our Product team can use this insight to develop new features.


.jpg)